Goto main content

MAREANO general biotopes - 2022 update - technical summary

Here we provide an overview of the methods used for biotope classification and modelling to produce the 2022 update to the MAREANO general biotope map.

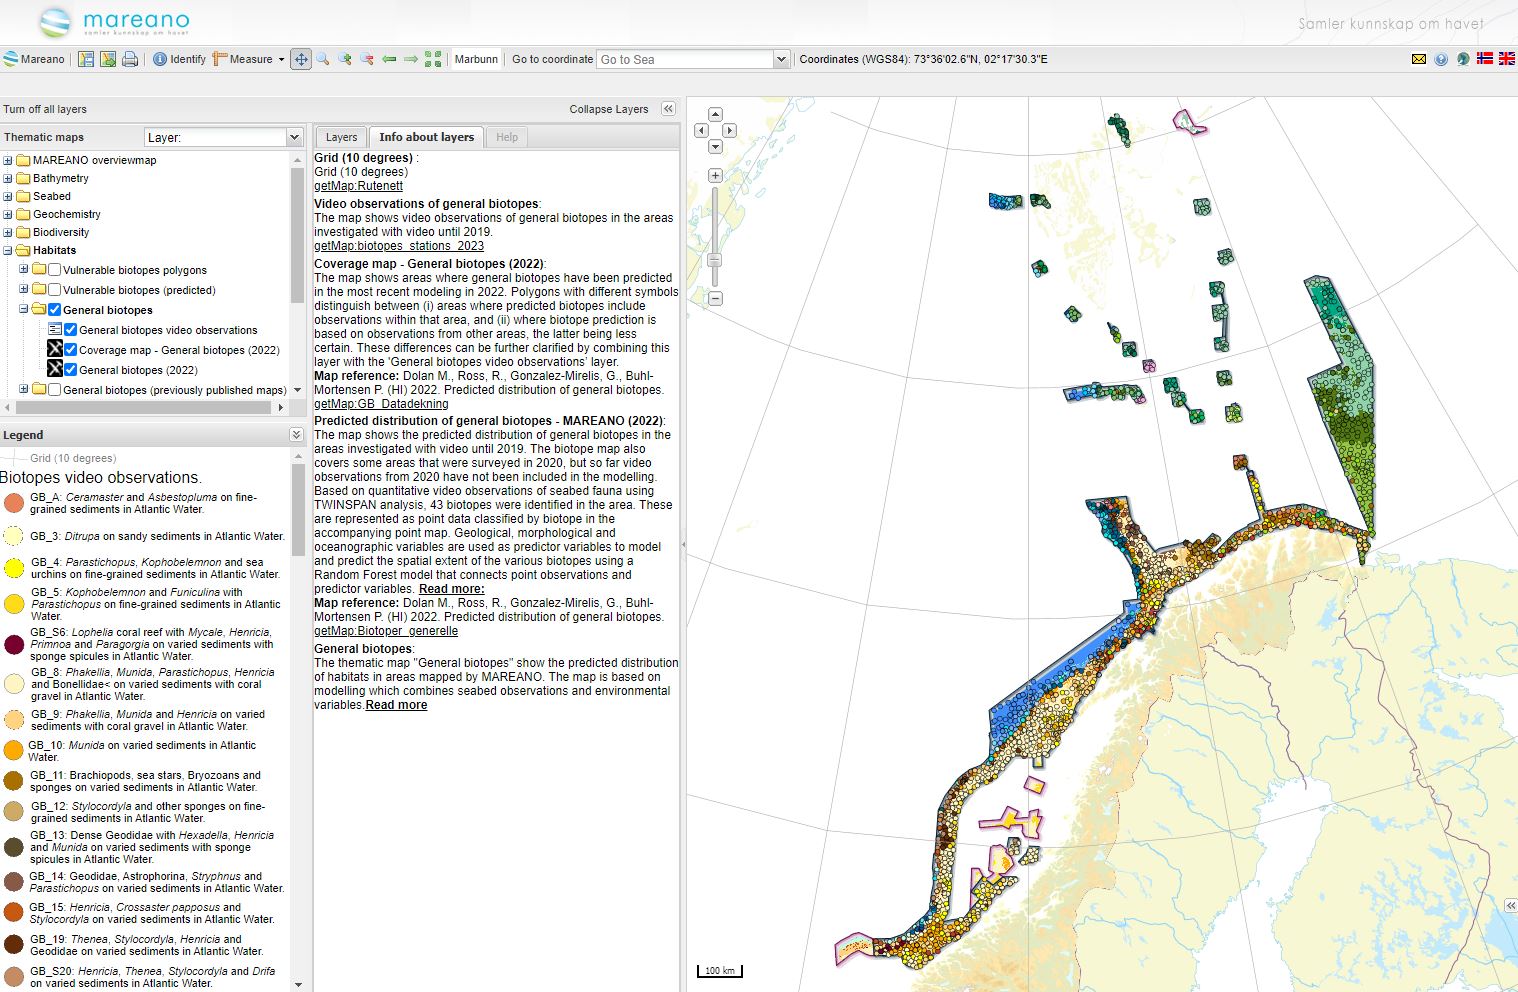
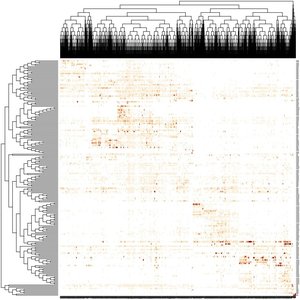
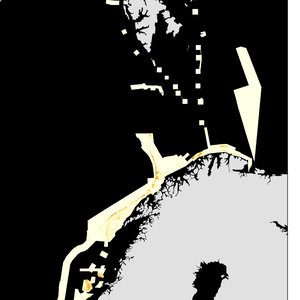
Firstly, we outline the methods used for classification of video observations into 43 general biotopes (the point map layer). We then summarise how full coverage maps showing the predicted distribution of general biotopes (the raster map layer) were produced using spatially-explicit modelling. This is the first time the entire MAREANO video dataset has been analysed together to produce a unified biotope classification and map; previous classifications and predicted maps were based on analysis of sub-areas. 

biotope map
Figure 1: Classified point samples used to train biotope models and full-coverage predicted biotope map. Note that areas far from point observations should be treated with caution as video data from these areas has not yet been included in the models (see also section on Spatial Uncertainty).


General classified biotope samples – point map

The general biotope classification is based on all video samples (200 m long sections of footage) for areas surveyed by MAREANO in the period 2006-2019. The species composition and environmental characteristics of each sample was used to create a biotope classification that categorizes the samples into classes with similar species compositions and consistent environmental characteristics. This classification results in 43 provisional general biotopes.

Predicted distribution of general biotopes – raster map

Once the biotopes are classified, we use spatially-explicit modelling to move from classified point observations to a full coverage map showing the predicted distribution of general biotopes. These models rely on full coverage predictor variables which are available for the entire study area – typically including environmental variables related to depth, oceanography, and geology.

Further work

The size of this dataset and the various types of noise inherent to video data and species annotations from multiple years mean that there are still steps we can take to refine this classification further. There are also alternative tools we are investigating to see if the classification process can be further optimized. This work is ongoing, alongside further improvements to our modelling methods, map products and supporting information, and in parallel to development of vulnerable biotope maps.

Appendix – Conservation Relevance

The conservation relevance of all 43 biotopes was assessed based on the OSPAR threatened and declining habitats list and the FAO Vulnerable Marine Ecosystems habitat list (see Annex 5 in this NEAFC document) to aid translation into management relevant habitats. The results of that interpretation are presented below. More information is available upon request.