Predicted distribution of general biotopes – raster map
Firstly, modelling links the biotope observations to the most influential environmental characteristics, then the model is used to predict into the remaining areas based on their environmental characteristics. The modelling development section below gives further technical details of the modelling methods and performance evaluation.
Note that predictions have been made into some areas where classified biotope samples were not yet available but for which the predictor variables, including MAREANO multibeam bathymetry and geological maps, are available. These areas are easily identified by overlaying the point map on the predicted map as in Figure 1 or by using the coverage map. In areas where the environmental conditions are different from those represented in the classified biotope sample dataset that was used to train the model, the predictions should be used with caution - see section on spatial uncertainty below.
Model development details
Full coverage predictor variables available for the area were assembled in GIS and resampled to a common resolution of 200 m. These include MAREANO multibeam bathymetry data and derived terrain variables, geological variables from MAREANO map products, modelled oceanographic variables, and other biogeochemical and environmental variables relevant to the benthic environment (from Bio-Oracle). First they were subjected to quality, spatial coverage and multicollinearity checks and several variables were eliminated. Following this pre-selection process, the remaining variables were selected according to their predictive ability for modelling biotopes as part of our model development procedures.
We built multiple (10) models using Random Forest modelling in the R software environment, each employing spatial cross-validation. Each of the 10 models uses a different realisation of test/training data for 3-fold cross-validation and produces slightly different results. Various options were tested including different combinations of predictor variables and model settings. Here we present and summarise the model with the best overall performance in terms of the Kappa statistic (a measure of confusion between classes which compares observed and predicted outcomes and a common metric for measuring the performance of multiclass classification models). The variables with the best predictive ability were selected based on multiple runs of the forward feature selection procedure in the CAST package for R. This iteratively adds predictors until no further increase in the performance metric is obtained (in our case the Kappa statistic). Pooling these results across our 10 models we identified seven predictor variables as the most important predictors. The reason for their importance may be due to direct or indirect relationships to biotope distribution with some variables serving as proxy variables for more direct ecological influences on the benthic communities.
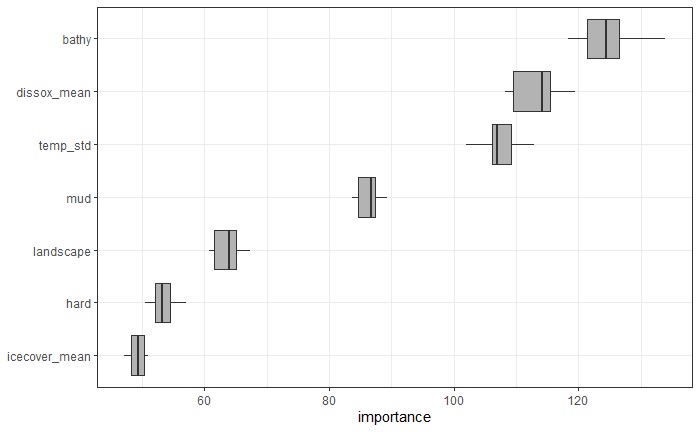
Following variable selection new Random Forest models were built using the selected predictor variables via the Caret package in R. From this modelling we obtain a ranking of the importance of each predictor variable (Figure 3).
The Kappa statistic across our models is in the range 0.5 - 0.53 which represents moderately good performance. The confusion matrix (with results pooled from all 10 models) gives further details on which classes are confused with others and is available on request. This tells us that certain biotope classes are more easily confused than others. This is not surprising since some biotopes have similar, or variable environmental characteristics and may share some common fauna. For example, GB_3 has a high error rate, frequently being misclassified.
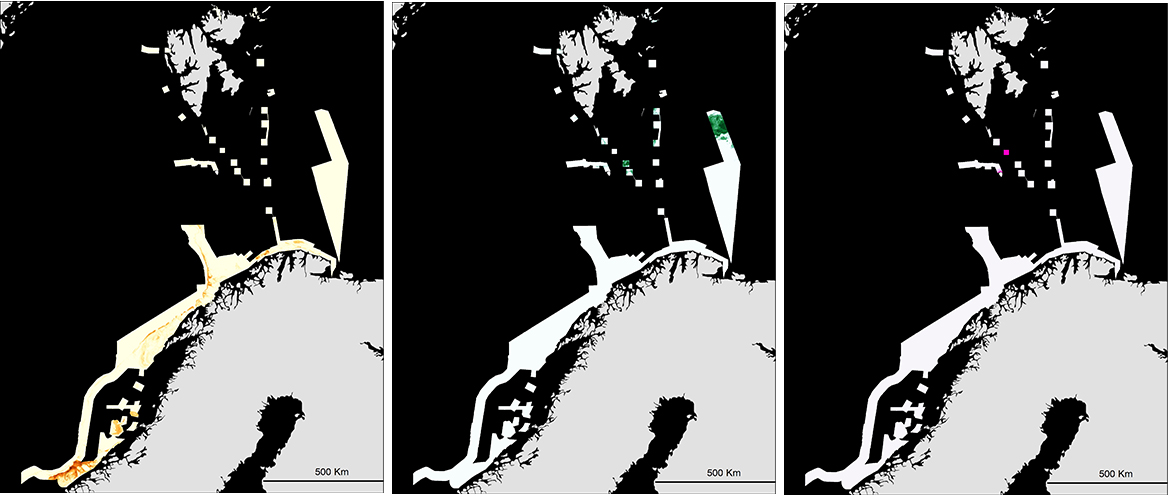
In addition to the classified general biotope map we obtain probability maps for each biotope. Some examples are shown in Figure 4. These maps are available on request. Note that the probability maps for certain biotopes may have a similar spatial distribution, also in some areas several biotope classes may have a similar probability. The classified maps show the most likely biotope for any given location (the biotope with the highest probability of occurrence). Generally, confusion between classes occurs where several biotopes have a similar probability of occurrence, especially when this probability is rather low. We can summarise this effect using various spatial uncertainty indices, some of which are outlined below.
Spatial uncertainty
Thematic uncertainty (misclassification of biotopes) is summarised to some extent by the Kappa statistic and confusion matrices from our models. Note that some of this uncertainty originates at the classification stage and therefore cannot be easily quantified. Thematic uncertainty is also linked to the spatial uncertainty (see Dolan et al. 2021 for further details) which is particularly important when the maps are to be used for spatial management.
Figure 5a summarises the Area of Applicability (AOA) of our models (i.e. where they are valid since their environmental conditions are well represented in the training data). Whilst most of the mapped area is within the AOA we note some particular areas where the results should be treated with extra caution as the environment has not been sufficiently well sampled. Not surprisingly, this includes many areas for which samples have not yet been included (Aktivneset, parts of mid-Norwegian shelf, Kvitøyrenna). We also note that large parts of the deep-water areas in Troms II-Nordland VII fall outside the AOA. This is a complex environment surveyed relatively early by MAREANO before more comprehensive sampling design procedures were adopted. It is also an area of much environmental variability which has previously been shown to be under-sampled relative to other areas (see van Son et al. 2015).
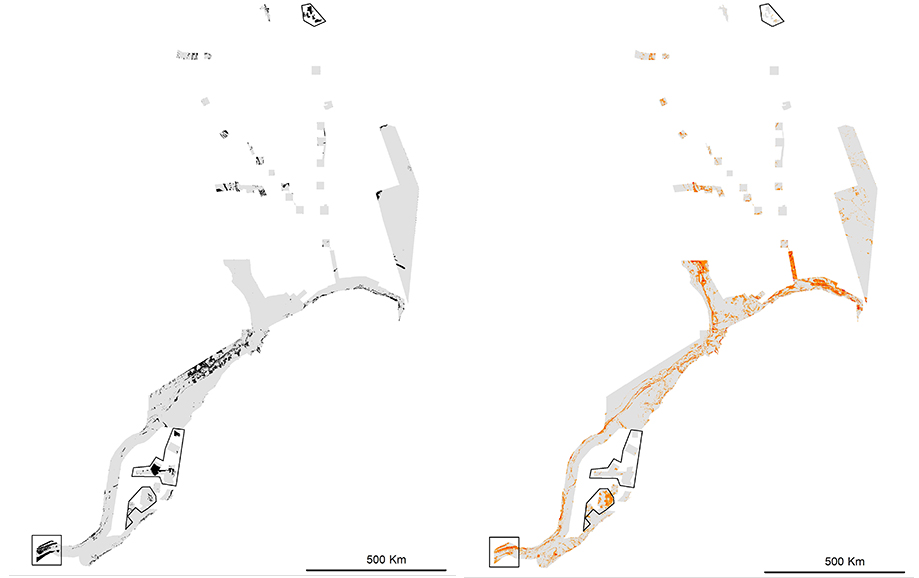
The Combined Confidence index highlights where the confusion between classes is high with this score being weighted by the probability of occurrence of the biotopes. We expect high confusion in transition zones between biotopes but high confusion elsewhere can indicate other issues. Again, in Figure 5 some of the areas lacking samples are uncertain, but we also note high uncertainty along the shelf break, especially near the Bjørnøya slide, as well as in Finnmark. In both these areas many biotope classes occur within relatively small and environmentally complex areas. Further, it appears that the (somewhat undersampled – see AOA) coastal part of Finnmark represents a transition zone between the warmer to colder water biotopes, perhaps elevating the risk of confusion.
Interestingly, Kvitøyrenna is not identified as uncertain by the Combined Confidence metric (presumably due to a lack of candidate alternative biotopes), however it is very clearly outside the AOA and thus should be regarded with extreme caution. This highlights the value of having multiple methods for addressing spatial uncertainty/validity. Further surveys were completed in Kvitøyrenna area during 2022, following which the geological maps will be updated and video data analysed for benthic fauna. These results will be included in future revisions of the biotope map.