General classified biotope samples – point map
These classified samples are represented by the point map. Each biotope is labelled GB_X (general biotope X) and its main environmental characteristics and typical fauna are described in the legend. Note that the X can be a number, a letter, or a combination of numbers and letters – the reasonings behind this are analytical at present and do not affect user interpretation. Future iterations will have a more user-friendly naming convention.
The colours used to symbolize each biotope represent the major splits in the biotope classification hierarchy. The major splits are between the warmer colours (yellows, reds, browns), corresponding with shelf/upper slope and warmer waters, and the colder colours (greens-blues) are used for biotopes in deeper and/or colder waters. Colours are further matched as far as possible with previously published (fragmenented) biotope maps. Biotope GB_73, which occurs on Spitsbergenbanken, is distinct in terms of characteristic fauna and environment (including being shallower than most MAREANO stations) and has therefore been given a distinguishing pink colour.
Classification analysis details
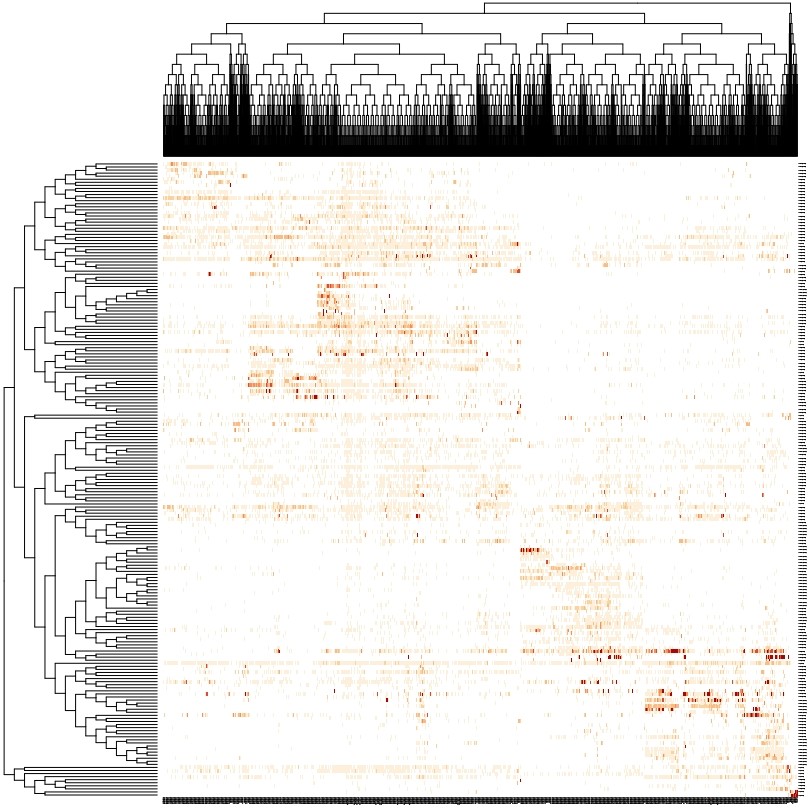
To arrive at this general biotope classification, the analysis, which is based on methods described in Buhl-Mortensen et al. (2020), used a TWINSPAN hierarchical ordination technique applied within the R Software Environment. Figure 2 shows an output of the TWINSPAN algorithm which clusters samples according to similar species compositions, and species according to sample similarity. In the figure the samples are clustered along the top (x ais) and species are clustered down the side (y axis) with colour shading in the center panel indicating the relative abundance of each species in each sample. From here, clusters of samples with a similar species composition were examined and pooled or split to find potential biotopes. Relative consistency in diversity, dominance and abundance of taxa was assumed to indicate a potential biotope. All potential biotopes were then cross-referenced with environmental data to a) remove those with inconsistent environmental conditions and b) quantify an environmental profile for each biotope before reaching our final classification.
We have also interpreted each biotope for its potential conservation relevance to help highlight which biotopes may be of management relevance, see Appendix for more information.
More details of the analysis are available upon request.