
General Biotope Map
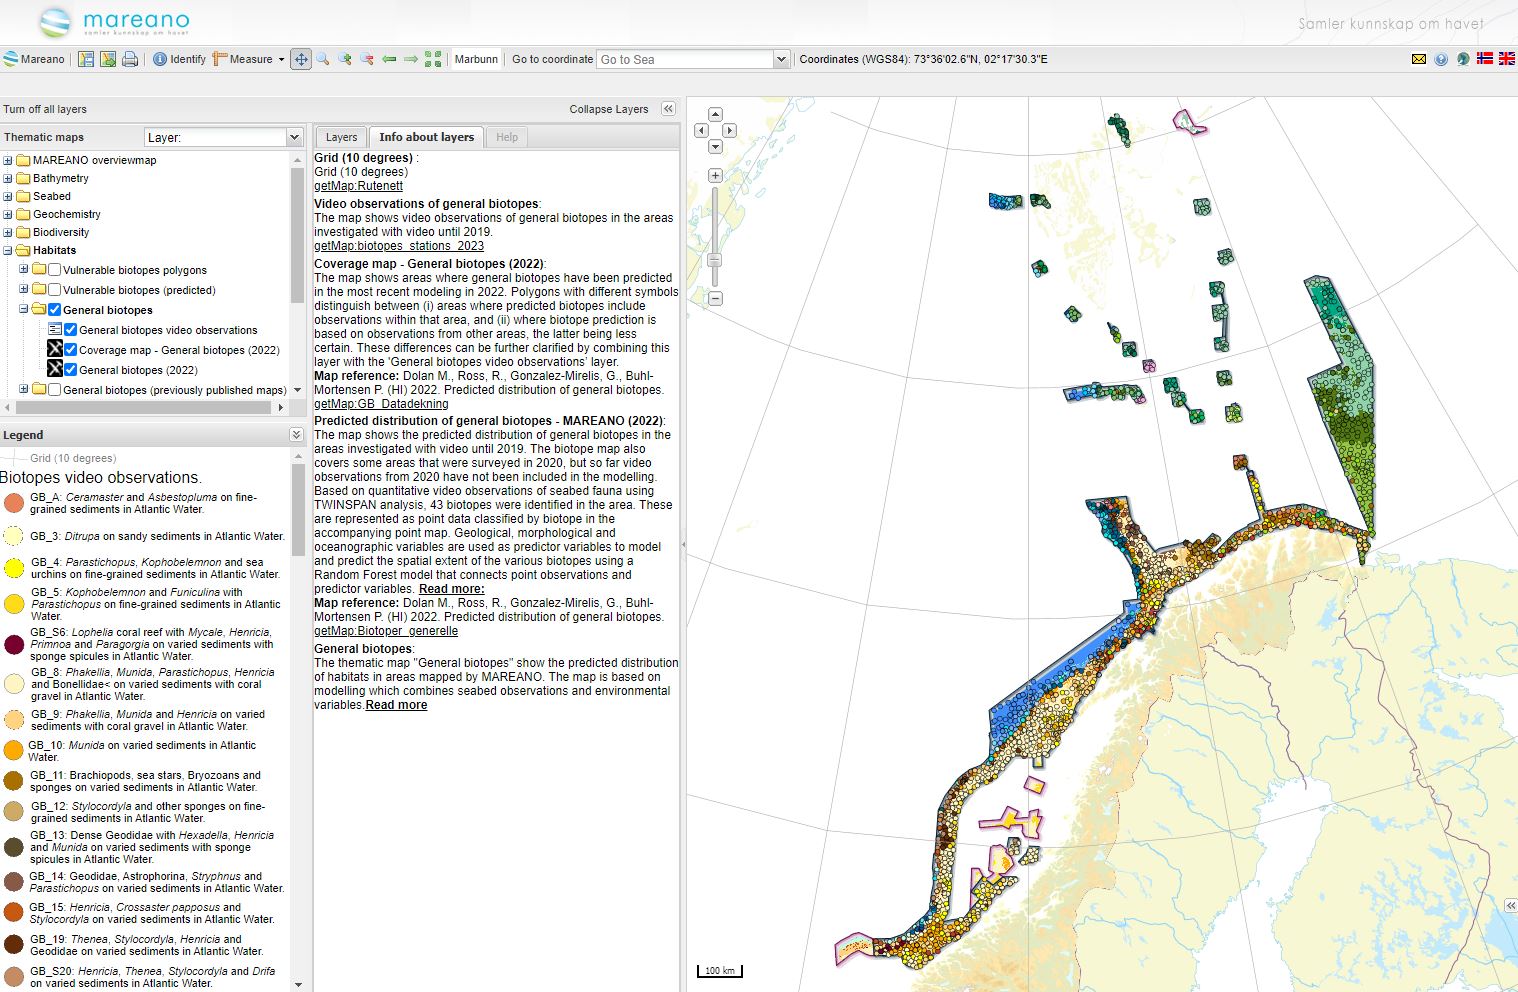
To produce full coverage maps of the distribution of general biotopes, as required by management, predictive modelling techniques are used. These models use information on the characteristics and distribution of biological communities (based on visual documentation at MAREANO stations) and combine this information with physical characteristics of the seabed identified by terrain analysis and geological interpretation. Since 2014, when oceanographic data first became available to MAREANO, these data have also been incorporated in biotope modelling. The figure below shows the coverage of biotope mapping in MAREANO to date. Further information on the production of biotope maps is available here.
Previously published general biotope maps which were produced for individual sub-areas are still available under General Biotopes (previously published maps). These will be phased out in due course, whilst updates will be produced to the unified map as data from new areas are included.
How are general biotope maps made?
MAREANO uses multivariate statistics and machine learning for the classification, modelling and prediction of biotope distribution. By identifying environmental variables (depth, geology, oceanography) relevant to the distribution of benthic communities we are able to select predictor variables that allow us to build a spatial model and use it to predict between video observations to produce full-coverage biotope maps.
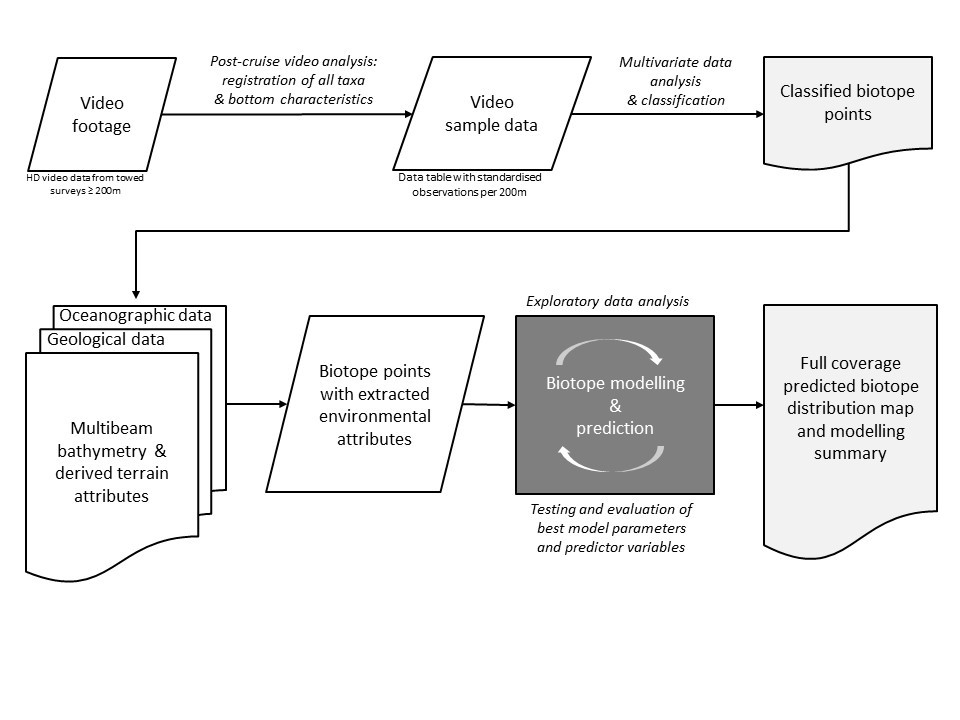
MAREANO has refined the methods used for spatial prediction of biotopes over the years since the first map for Tromsøflaket was produced in 2008, testing various methods for classification and modelling as well as improving methods for map validation. A generic workflow for biotope classification, modelling and prediction is summarized in the figure below. This work is a collaboration between IMR and NGU.
Here you can read more about how we have performed the classification and used modelling to make the latest maps. You will also find some information about the spatial uncertainty of the maps and their management relevance.
Contact