
Modelling of bottom currents
Published: 22.04.2015 Updated: 15.06.2022
To estimate the bottom currents we use a numerical ocean model, which is, in principle, a set of equations that describe the physical state of the ocean, such as temperature and salinity. The set of equations is non-linear and cannot therefore be solved analytically. Therefore, we first simplify the set of equations by applying a set of assumptions, and then we utilize numerical methods to solve the equations. This requires a lot of computing power. Therefore, a super computer, which consists of many processors, is used to solve the simplified set of equations on a regular grid that covers the study area. The output is information on temperature, salinity, current speed and direction, ice cover, sea level, and so on and representative for different depths within each cell of the grid.
Ocean current modeling in MAREANO
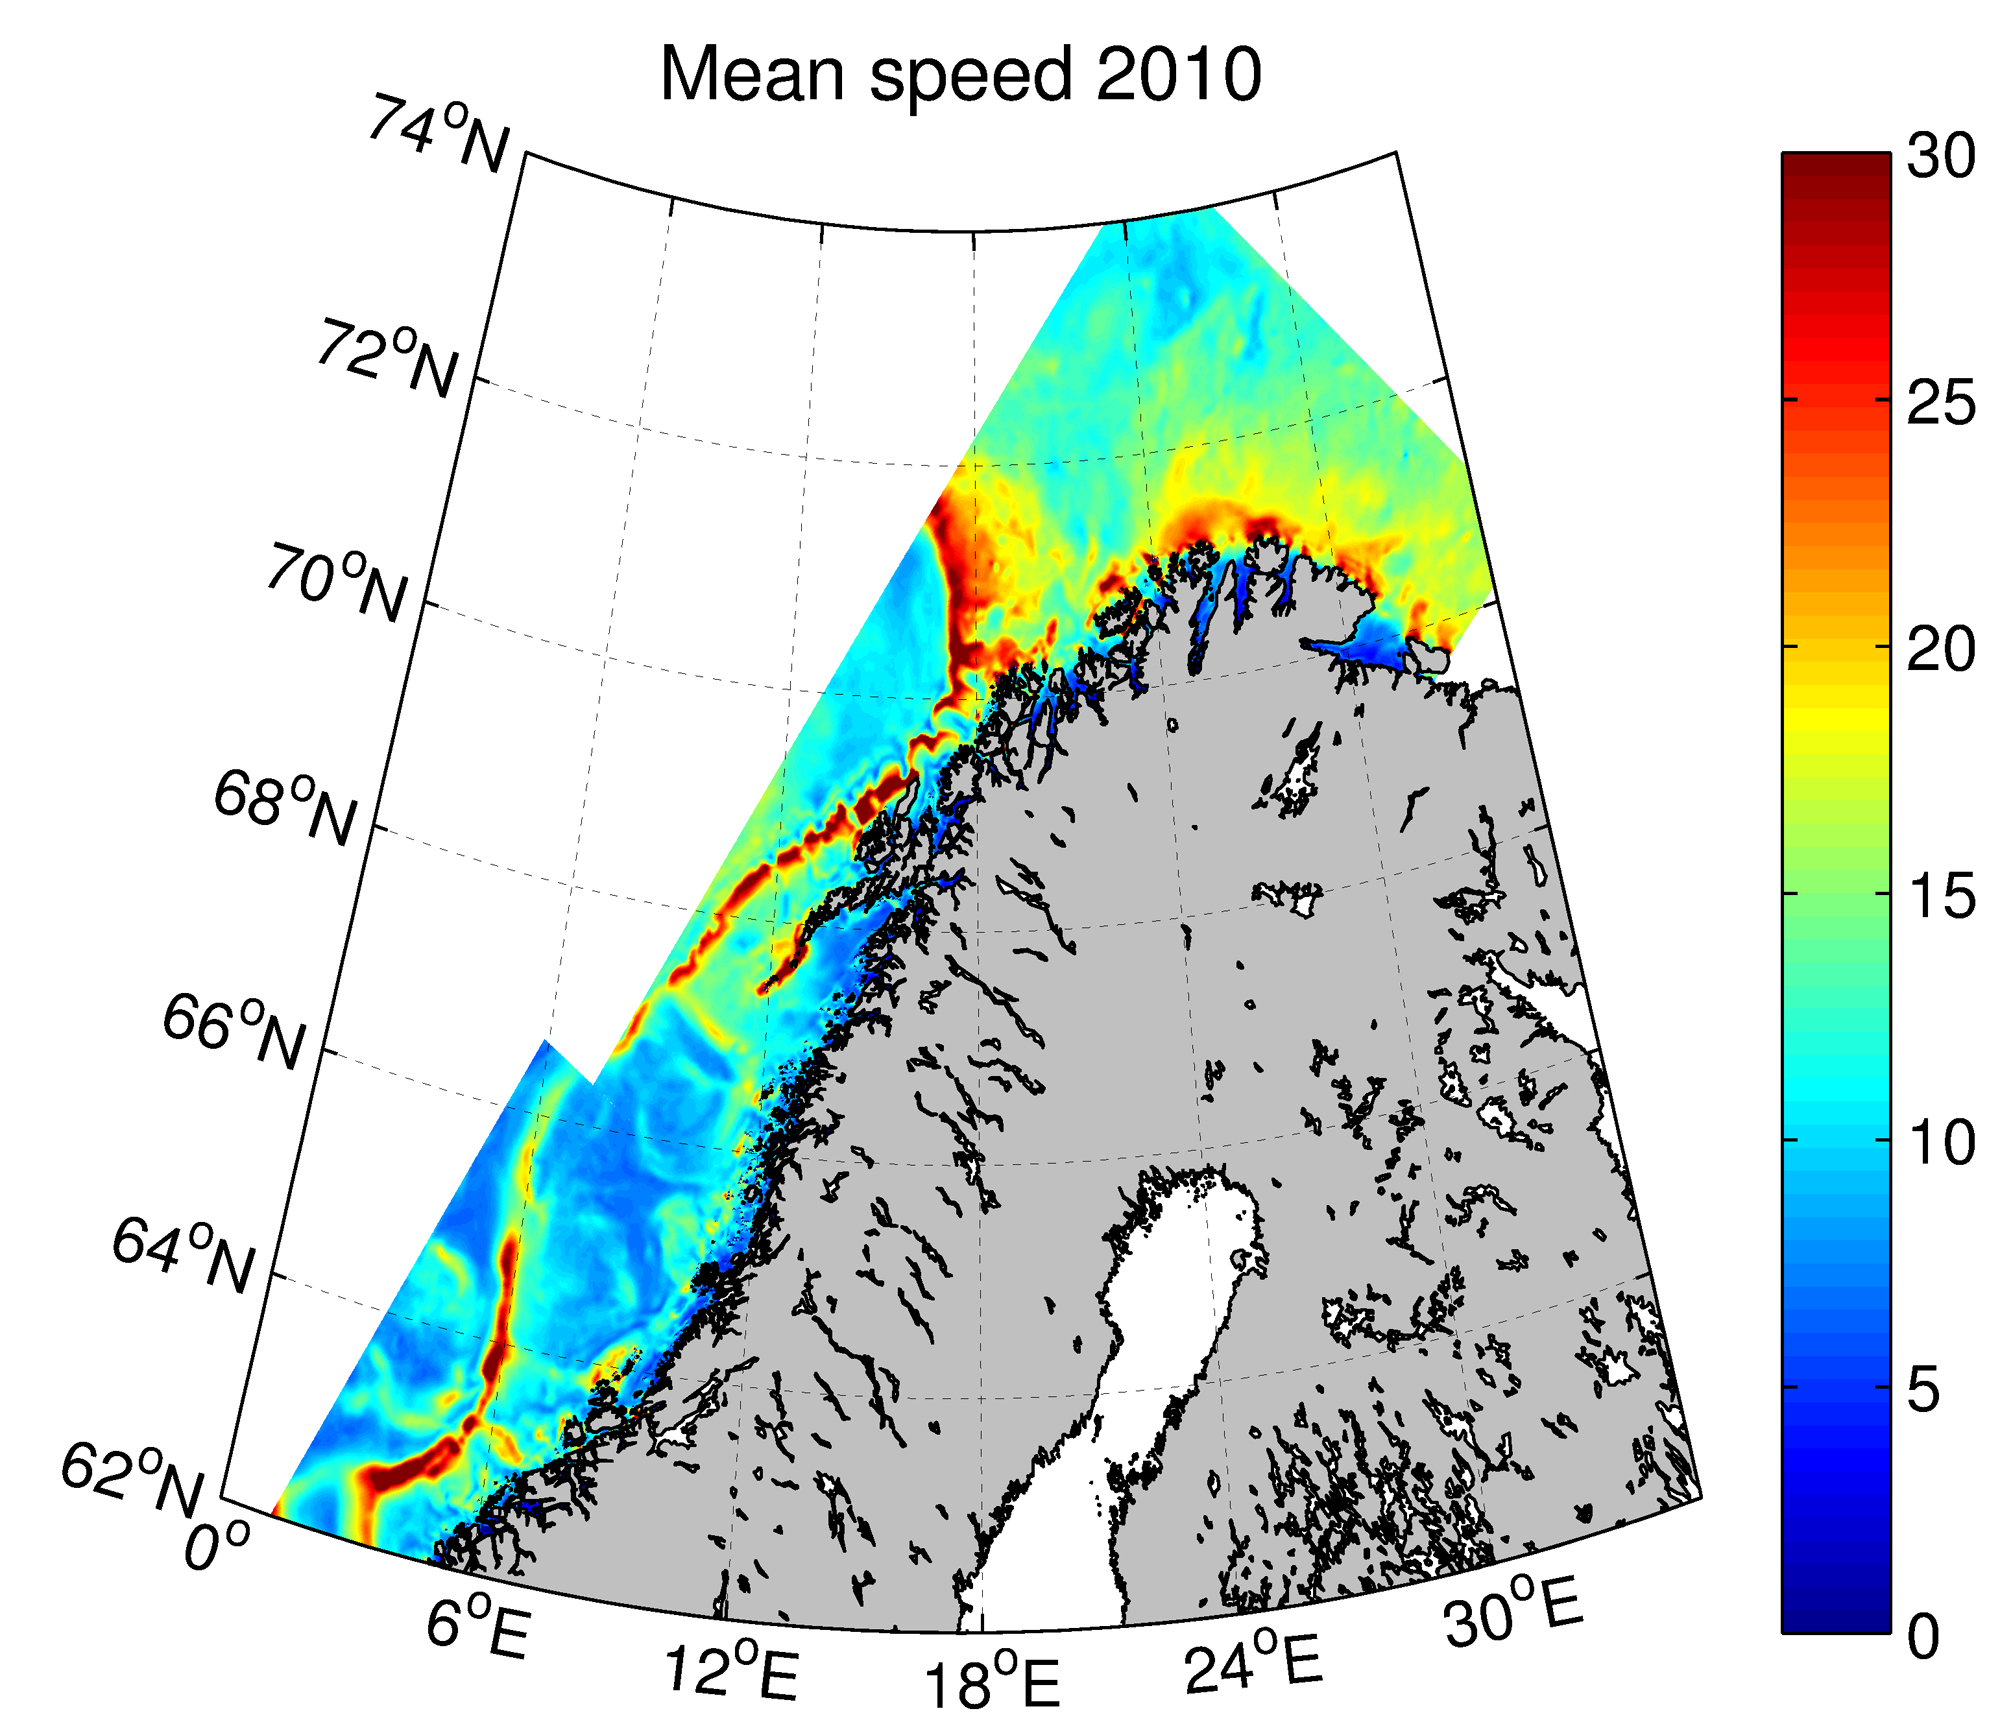
In MAREANO, the NorKyst-800 (Albretsen et al., 2011), which is a numerical ocean model that covers the whole Norwegian coast with an 800 meter resolution grid, is used. In MAREANO, the NorKyst-800 is set up for the coast from Møre to Varanger. This means that we get information on the state of the ocean as an average within cells of 800 times 800 meters. This information is output for every hour, so that processes such as tides are included in the output and can be studied. Specifically for MAREANO, information on minimum and maximum values of temperature, salinity and current speed representative for the near-bottom and within months and a full year is extracted from the model.
Because the model used utilizes relative depth as the vertical coordinator, the thickness of the bottom layer representing the near-bottom conditions vary with the depth within each grid cell. In shallow areas, the thickness is typically on the order of 10 meters, whereas in deep areas the thickness is typically on the order of 100 meters. In other words, it is not the conditions exactly at the bottom that is modeled, but rather the average for the lower part of the water column. In areas with high bottom roughness, which induce large friction and subsequently a thick bottom layer, modeled currents in the lower parts of the water column can deviate substantially from the actual currents at the very bottom.
Observational data included
A numerical ocean model contain several sources of error, which include the simplification of the set of equations as mentioned above, as well as errors in input data, such as atmospheric variables used to force the ocean model, in addition to errors originating from the numerical methods applied to solve the equations numerically. In order to get information on the quality of the model results, it is necessary to compare the model results with observational data, similar to calibrating an instrument.
The model that is used in MAREANO has been compared with observations of temperature, salinity and currents at nine locations in the Lofoten area. At these locations, so-called ADCPs (Acoustic Doppler Current Profiler) have been deployed at the bottom. The instruments measure currents throughout the water column, as well as temperature and salinity at the bottom. In addition, the model results have been compared with temperature and salinity observations outside Eggum and Skrova in the Lofoten Archipelago. Here, local fishermen, hired by the Institute of Marine Research, head out to obtain hydrographic measurements 1-2 times every month.
The comparisons show that the model reproduces the dominating currents, although the current speed tends to be too high. Moreover, the modeled temperature tends to be too high, whereas the salinity is generally lower than observed. However, the modeled temperature variability is significantly correlated with the observations. We therefore conclude that the model provides useful information on the oceanographic conditions along the coast and on the shelf.
The results are available
The model results from the NorKyst-800 are available both as hourly averages and daily averages for the years 2009 and 2010. Due to the large amounts of data, the model results are stored at the super computer Hexagon at the University of Bergen. However, they are available at request. Requests for model results should be directed to Vidar S. Lien or Jofrid Skardhamar, both at the Institute of Marine Research.
References:
Albretsen J, Sperrevik AK, Staalstrøm A, Sandvik AD, Vikebø F, og Asplin L. 2011. NorKyst-800 Report No. 1 User Manual and technical descriptions. Fisken og Havet 2/2011
Contact