
Technical Summary: Classification and prediction of general biotopes in the Barents Sea
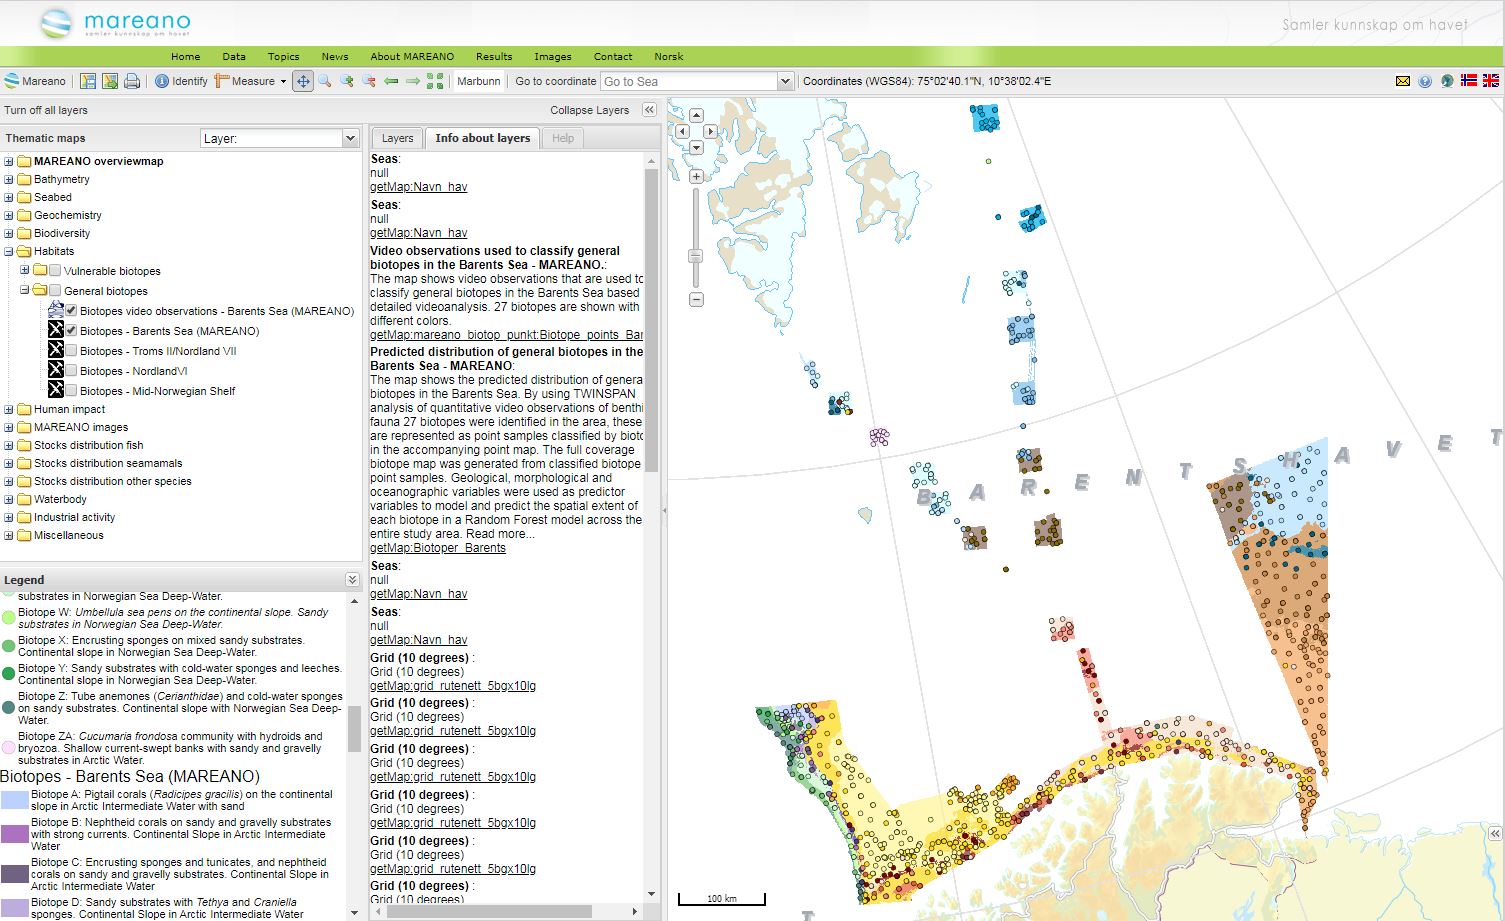
General biotope samples – point map
General biotopes were classified on the basis of species composition documented by video data. The video data consists of estimates of abundance (individuals per 100 m2) and percentage coverage of animals and algae along 100m long stretches of video records. In total 757 video stations were split into 2959 samples, each approximately 200 m long. Rare species (or higher level taxa) that occurred in less than 5 samples were removed from the data set. Higher level taxa that represent many species (e.g. Porifera (Sponges) or Actiniaria (Sea anemones)) were also removed as they are too generic to provide meaningful results; and small organisms, such as Foraminifera (large unicellular organisms) and Amphipoda (crustaceans generally smaller than 5mm) were removed because they were not always possible to detect along the video lines. After removing these taxa, samples with less than 5 taxa were removed from the dataset. This cleaning of the dataset was performed in order to better distinguish the main species composition patterns, that are the foundation of biotope classification. After the data cleaning process, the data table consisted of 2913 video samples and 222 taxa. This dataset was analysed using Two Way INdicator SPecies ANalysis (TWINSPAN), which grouped the sample data into those with similar species composition and provided indicator species for each group. Subsequent divisions of the dataset were run until no further division of groups was possible based on TWINSPAN statistics. In order to maintain an adequate number of samples within each group, with a view to modelling and prediction of biotope distribution, groups with less than 20 samples were merged with “parent groups” (i.e. raised one level in the classification hierarchy). Following merging we identified a total of 27 groups, each with 23 or more samples.
The key environmental characteristics of each group, or biotope, were subsequently identified using ordination techniques and, together with characteristic fauna, form the biotope description. The samples are provided as a map of classified points which can be viewed alone or together with the predicted full coverage general biotope map as required.
Predicted distribution of general biotopes – raster map
The full coverage raster biotope map shows the predicted distribution of biotopes in the Barents Sea based on models which combine the observed biotopes with environmental data. This approach allows us to use predictions to fill in the gaps between MAREANO stations and sample points and provide a full coverage map of probable biotope occurrence.
Modelling and prediction was conducted using Random Forest models using the Ranger package in R. Environmental predictor variables were pre-selected for biological relevance based on comparison with TWINSPAN splits. These include oceanographic variables (temperature, salinity, bottom current strength, satellite derived variables), bathymetry, geological variables (sediment type, landscape), geographic variables (X,Y coordinates). The best predictor variables i.e. those used in the final model were identified though a combination of model performance statistics and visual validation of the predicted map. Visual validation, although somewhat subjective, was found to be an important step since performance statistics alone can fail to distinguish between results that are artificially influenced by results from one of more predictor variable. During map development several methods for automated selection of optimal predictor variables were tested, however no methods were found to outperform our combined approach.
The raster map showing the predicted distribution of general biotopes is at 200m resolution which matches the scale of the biological sample data. Environmental data were resampled to this resolution as required, using bilinear resampling for continuous data. The model classification was evaluated using the Kappa value which is a suitable performance statistic for multi-class problems. The final model has a Kappa value of 0.59 which is at the upper end of a moderate predictive performance across all biotopes – this seems reasonably good given the small percentage of raster pixels containing a biotope sample (<0.2%). Higher (overestimated) performance statistics were possible to obtain with (standard) methods that do not account for the ability of the model to predict to new locations, but more conservative estimates are more suitable here. We note that certain biotopes are more distinct in terms of their environmental properties than others. These are generally easier to predict (have a lower rate of false predictions), although the predictive ability is also influenced by the number of samples in each biotope class. Work is ongoing to provide a convenient and reliable method for communicating the degree of uncertainty associated with the distribution of each biotope.
General comments
The new biotope map provides a good overview of the varied environment and benthic communities present in the Barents Sea, including many areas previously undocumented at this scale. This is the first MAREANO biotope map that extends into Arctic water and north of the Polar Front. We recognise several cold water biotopes towards the north and east of the study area that are quite distinct from those in Atlantic water or Norwegian Sea Deep Water. Overall we note that the influence of major water masses is very important in controlling biotope distribution with oceanographic variables consistently being among the most important predictors. The importance of geographic variables (location) as proxies to more direct influences on benthic communities suggests that other variables besides those used in the present model may be relevant. Nevertheless, the geographic variables appear to provide adequate proxies until such time as the relevant data are identified and available for use in future models. Due to the need for sufficient observations of each biotope to facilitate successful modelling, a few biotopes are less specific than might be desirable. For example Biotope L which contains both sponge habitats and cold-water corals. Once the dataset is expanded and analysed over the entire MAREANO area, including areas where cold-water corals are found in greater numbers, we expect these classes to separate. Similarly, biotope ZA present on Spitsbergenbanken appears to be unique to this mapped area, and fortunately had sufficient samples to be retained as a distinct biotope class. However, we note that no similar environments have yet been mapped by MAREANO so the extent of its uniqueness is as yet unknown. These examples illustrate how it is important to take into account the limitations of sampling and mapping areas covered when assessing the results of biotope mapping.
Contact