Contact
Biological mapping
Børge Holte
+47 77 60 97 53
Geological mapping
Terje Thorsnes
+47 73 90 42 75
Bathymetry
Hanne Hodnesdal
+47 51 85 88 23
Information officer
Beate Hoddevik Sunnset
+47 55 23 85 16
Published: 10.08.2010 Updated: 18.08.2022
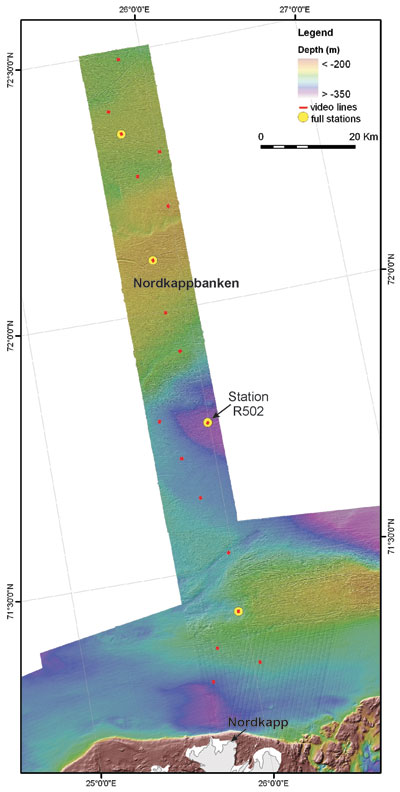 Figure 1. Depth relief map of the investigated area on the Nordkappbanken with location of stations. (Click on map for larger version) |
The MAREANO program uses a variety of methods to characterize the sea floor: Multi-beam echo sounder provides detailed depth map as shown in Figure 1.
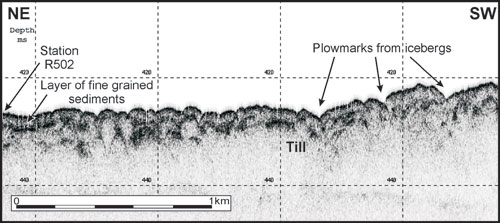
700 m long video lines shot using HD camera provides detailed images of surface sediments. In a selection of these lines it was also taken samples of the seabed, by grab, box-corer and multicorer. Areas between the lines and sampling stations are surveyed with Topas, which is a hull-mounted sonar that gathers information on sediment layers.
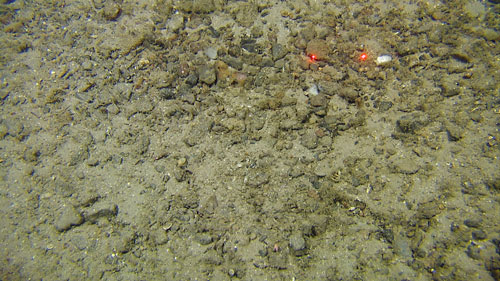
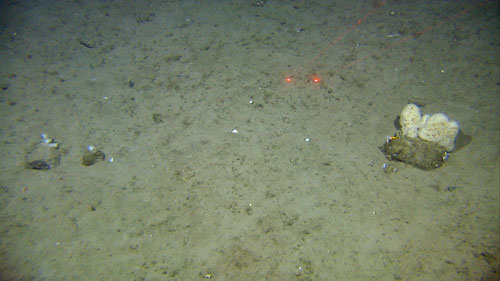
The detailed depth map shows many plowmarks from icebergs from the end of the last ice age. Video footage shows some variation along the 150 km long transect (see Figure 2). The presence of large, rounded stones and compact clay with sand and gravel are clear indications that glacial sediments were deposited here, and they still characterize the seabed. Another indication that the surface sediments are from the last ice age, is the presence of up to 2 cm large pebbles a few centimeters below the seabed in a sediment core with a high percentage of silt and clay. Such deposits can be interpreted to be glacimarine with supply of drop stones from icebergs.
There are also other seabed types in the investigated area. In the deeper part there is deposited clay, silt and fine sand on the seabed, with no occurrence of either gravel or stone. This suggests continuous deposition of fine sediments, and Topas data show that this process may have been going on since the last ice age.
Relatively strong bottom currents are probably the cause of low or no sediment deposition on the shallow bank areas. This is in contrast to the deeper areas where bottom currents are weaker, and sediment is deposited continuously.
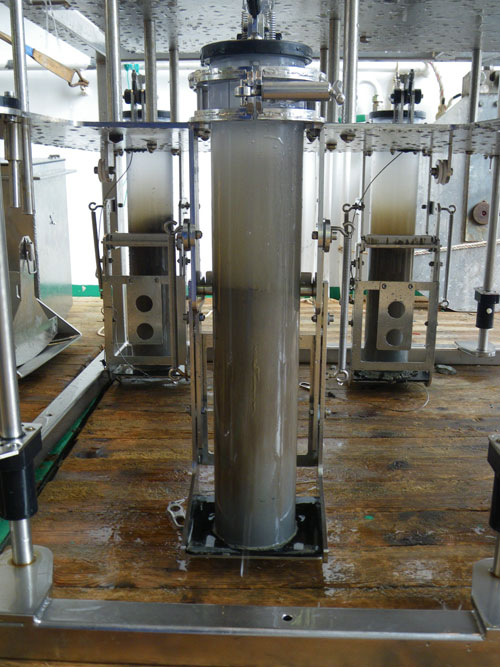
Samples of fine sediment (mud), primarily composed of silt and clay, is taken with multicorer (see Figure 4). Such sediment cores are used by IMR and NGUIMR and NGU use such sediment cores for the analysis of pollutants, especially in the surface, to see the state of pollution as it is today However, it is also important to analyze complete sediment cores for pollutants, which can tell how the contamination condition has evolved over time. For this purpose the content of lead-210 is analyzed, which can give the age of the sediment core material back to ca. 1860. Supplemented with Cesium-137, it is possible to calculate the sedimentation rate (how fast sediments have been deposited) and when any hazardous substances were deposited.